


In our article, we'd looked at the number of titles with sales above 100,000, 75,000, and 50,000, and found that January 2015 displayed weakness on all those measures, comparable to January 2011. Bardyla looked at the numbers differently. "The interesting number, to me, is the total number of the Top 300 books distributed to comic stores," he said. "If we use the same reference point in the article, January 2011, we see that the #300 title sold 1,291 copies while in January 2015, #300 sold 4,419. This could indicated a stronger market overall if people are just diversifying their reading."
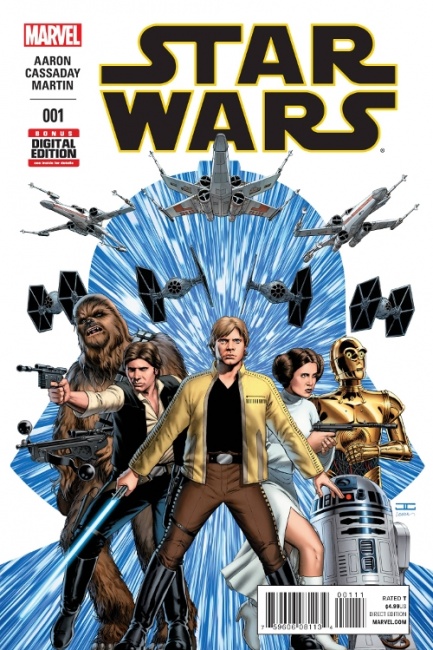
So we took a closer look at the comparison between the two months, January 2015 (see "Top 300 Comics--January 2015") and January 2011 (see "Top 300 Comics--January 2011”), both of which showed weakness in the number of titles above 50,000. First, as Bardyla suggested, we looked at the total number of comics in the Top 300 and found that there were 6,807,586 in 2015 and 4,402,738 in 2011; January 2015 was 55% larger. Even if the anomalous Star Wars #1 numbers were excluded from the 2015 number, the number of comics in the Top 300 was up 32% between 2011 and 2015.
If the comics above 50,000 weren’t where the big differences between 2011 and 2015 were (except for Star Wars #1), where were they? Everywhere else, it turns out.
|
Comparing Comic Sales at Various Title Ranks |
|||
|
Rank |
Jan. 2011 |
Jan. 2015 |
Delta |
|
1 |
115,448 |
985,976 |
754% |
|
5 |
64,867 |
74,849 |
15% |
|
10 |
56,749 |
66,097 |
16% |
|
15 |
51,381 |
50,993 |
-1% |
|
20 |
43,471 |
46,832 |
8% |
|
25 |
39,486 |
43,573 |
10% |
|
50 |
29,144 |
33,965 |
17% |
|
100 |
14,530 |
21,382 |
47% |
|
200 |
5,036 |
8,383 |
66% |
|
300 |
1,291 |
4,419 |
242% |
We compared the sales of books at a number of ranks and found that through the Top 50, there were relatively small differences, but beginning with #100, the differences between 2011 and 2015 started to grow, with sales at #300 242% larger in 2015 than in 2011.
Is that because, as Bardyla suggests, buyers are spreading their purchases around a more diverse range of books? It certainly looks like it, and that bespeaks a healthier market, with more potential sources of strength than one concentrated in a few big books. But it's still concerning to us that there seem to be fewer books with the ability to motivate purchases from larger numbers of people. That may change as we head into the summer, with more Star Wars titles and Secret Wars from Marvel, and DC’s Convergence and relaunch events. We'll be watching.