


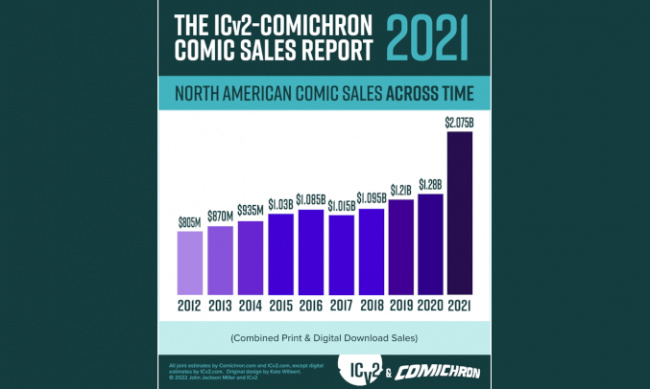
An ICv2 Release. Sales of comics and graphic novels grew over 60% in 2021, according to a new joint estimate by ICv2's Milton Griepp and Comichron's John Jackson Miller. Total comics and graphic novel sales to consumers in the U.S. and Canada were approximately $2.075 billion, a 62% increase over sales in 2020 (for 2020 report, see "New High in Pandemic Year"), and up over 70% from sales in 2019, the last pre-pandemic year (see "Sales Top $1.2B in 2019").
“Publishers made more selling comics content than in any year in the history of the business, even when adjusted for inflation,” said Miller of the 2021 estimates. “The biggest year in the modern era, 1993, saw sales of around $1.6 billion in 2021 dollars — and the pricier product mix puts 2021 ahead of what the colossal circulations of the early 1950s brought in, also adjusted for inflation.”
Topping 2020 numbers was easily done, as most brick-and-mortar retailers were shut down to foot traffic for periods during the year, but it was more impressive that numbers exceeded 2019’s by a hefty margin. Graphic novel sales were especially strong in the manga category, and periodical comics also had a great year, easily beating 2019.
“While graphic novels lead the way, comic sales also exhibited high growth in 2021,” Griepp noted. “Graphic novels were up an astounding 76% growth across channels, while comics were up 53% vs. 2020 and up 23% vs. 2019.”
Also impressive was the growth across channels. “Sales were up across all types of retailers,” Griepp said of the numbers in the analysis. “Sales through comic stores were up 60% vs. last year and 34% vs. 2019; sales through the book channel, including book fairs (which were back in operation) grew at a blistering 81% pace. Digital growth, while slower, was coming off a gangbuster year in 2020 during the shutdowns.”
“The only subchannel which dropped was the newsstand portion of our ‘Other’ channel — and crowdfunding grew enough to offset that loss.” Miller noted.
The increased dollars in the comics format and in comic stores were generated by fewer releases than in pre-pandemic years. “The comics shop market and the comic book format rebounded strongly, beating pre-pandemic unit and dollar sales numbers even with new release slates that had not yet returned to 2019 sizes,” Miller said.
Changes to the analysts’ methodology for estimating sales through comic stores after big changes in comic distribution and reporting in 2020 continued for 2021. The analysis now uses data based on sales tracked at point-of-sale by the ComicHub system at over 100 stores. We have used that data to build a model of sales for the entire comic store channel using comparisons developed during periods in which ComicHub and Diamond reporting overlapped.
We also continued refinements in how we use NPD BookScan data; NPD began incorporating ComicHub data into its reports in 2020, so we accounted for the ComicHub portion when estimating the size of the book channel. NPD BookScan collects weekly point-of-sale data on print books from over 16,000 locations including e-tailers, chains, mass merchandisers, independent bookstores, and more. NPD BookScan covers approximately 85% of the overall U.S. trade print book market. Some publishers classify titles that are primarily text, or art books, as graphic novels; those titles are manually removed from the analysis. This year for the first time, via information provided by NPD BookScan, we were able to incorporate sales on graphic novels not classified as such by the publishers (e.g., Maus) in our analysis.
As presented above and in the accompanying infographics, the analysis by Comichron and ICv2 was divided up between periodical comics (what some call "floppies" or "pamphlets"), graphic novels, and digital download-to-own sales. All print figures are calculated based on the full retail price of books sold into the market, and do not account for discounting or markup. Digital sales do not include subscription-based "all you can read" services.
The "Other" channel in our channel breakdown includes the Newsstand (periodical sales through specialty retail and mass merchant chains) and crowdfunding (Kickstarter, etc.) channels. This is the ninth joint market size analysis from ICv2 and Comichron; the first was for 2013 sales.
For ICv2's complete market reports for both comics and hobby games, see Internal Correspondence #102.
Click Gallery below for the Comic Sales Report graphs for 2021!
ICv2
ICv2 is the #1 industry source on the business of geek culture, including comics and graphic novels, hobby games, and the media world surrounding them, on its website, ICV2.com and in its magazine, Internal Correspondence. For the people on the front lines of the geek culture business, staying ahead of the trends isn't something that can be left to chance-it's a basic necessity for being successful. That's why ICv2, where trend-watching is a science, is the #1 source of news and information for the buyers, gatekeepers, and tastemakers.
Comichron
Comichron is the world's largest public repository of comic-book sales figures, featuring data from the 1930s to today about comic book and graphic novel circulation, cover prices, and market shares on its website, comichron,com. With data and analysis on the distant past as well as the present, Comichron serves as a trusted resource for academics studying the historical reach of the medium and for collectors seeking accurate information about how many copies of a comic book originally circulated.
According to New Estimate by ICv2 and Comichron
Posted by Milton Griepp on June 30, 2022 @ 2:00 pm CT
 View Gallery: 5 Images