


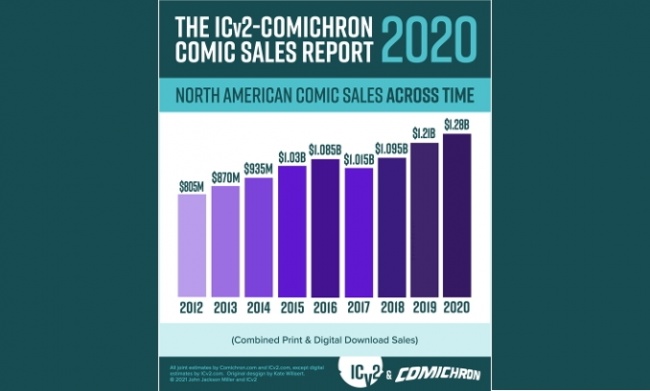
An ICv2 release. Combined comics and graphic novel sales hit a new high in the pandemic year of 2020, according to a new joint estimate by ICv2's Milton Griepp and Comichron's John Jackson Miller. Total comics and graphic novel sales to consumers in the U.S. and Canada were approximately $1.28 billion in 2020, a 6% increase over sales in 2019. The increase was due to strong sales of graphic novels online and in mass merchants and strong digital sales, which overcame big declines in comic and book store sales.
"The challenges of retailing in the pandemic had profound impacts on the market, including the acceleration of trends that have been in place for years," Griepp said of the 2020 estimates. "The book channel increased its share dramatically vs. comic stores, and graphic novels increased their share vs. periodical comics, while digital sales were turbocharged."
Sales of kids’ graphic novels in mass merchants and online drove graphic novel sales early, and as the pandemic went on (and anime streaming grew), manga sales took off. In the comic store channel, the seven-week shutdown by Diamond Comic Distributors and subsequent publisher cutbacks in periodical releases were a drag on sales, even as demand surged in the second half of the year.
"The comic periodical market was ahead for the year before the pandemic struck, and the result of production cutbacks was that 30% fewer new comic books were released by the major publishers in 2020," Miller said. "The fact that new comics sales were down by only 20% suggests that retailers did well with what they were able to get."
Not only was demand high for new comics and graphic novels, the collectible side of the comics business was also strong. "The collector market flourished during the year, allowing comics shops to earn significant revenue from their back-issue inventories," Miller added. "Many new releases also saw significant levels of markup that our charts would not be able to capture, all of which helped stores offset the lack of new product."
For both independent comic and book stores, healthy consumer demand, strong community support, and help from government programs and the Book Industry Charitable Foundation kept the store attrition rate lower than expected.
"I’m encouraged by the way independent retailers selling comics and graphic novels are coming out of the pandemic shutdowns," Griepp said. "Combined with the robust growth in other channels, the business is in overall good condition to serve the many new consumers that started enjoying comic-form entertainment over the past year."
Big changes in comic distribution and reporting required substantial adaptations in the analysts’ methodology for 2020. Diamond Comic Distributors halted its release of sales information in 2020, as the movement of DC Comics to a new distributor made their reports an incomplete picture of the market. Instead, the analysis uses data based on sales tracked at point-of-sale by the ComicHub system at over 100 stores. We have used that data to build a model of sales for the entire comic store channel using comparisons developed during periods in which ComicHub and Diamond reporting overlapped.
We also altered how we use NPD BookScan data; NPD began incorporating ComicHub data into its reports in 2020, so we accounted for the ComicHub portion when estimating the size of the book channel. NPD BookScan collects weekly point-of-sale data on print books from over 16,000 locations including e-tailers, chains, mass merchandisers, independent bookstores, and more. NPD BookScan covers approximately 85% of the overall U.S. trade print book market. Some publishers classify titles that are primarily text, or art books, as graphic novels; those titles are removed from the analysis.
As presented above and in the accompanying infographics, the analysis by Comichron and ICv2 was divided up between periodical comics (what some call "floppies" or "pamphlets"), graphic novels, and digital download-to-own sales. All print figures are calculated based on the full retail price of books sold into the market, and do not account for discounting or markup. Digital sales do not include subscription-based "all you can read" services.
The "Other" channel in our channel breakdown includes the Newsstand (periodical sales through specialty retail and mass merchant chains) and crowdfunding (Kickstarter, etc.) channels. Kickstarter was a contributor to growth, with comic funding up 60% in 2020.
This is the eighth joint market size analysis from ICv2 and Comichron; the first was for 2013 sales.
Click Gallery below to see the Comic Sales Report graphs for 2020!
ICv2
ICv2 is the #1 industry source on the business of geek culture, including comics and graphic novels, hobby games, and the media world surrounding them, on its website, www.ICv2.com, and in its magazine, Internal Correspondence. For the people on the front lines of the geek culture business, staying ahead of the trends isn't something that can be left to chance-it's a basic necessity for being successful. That's why ICv2, where trend-watching is a science, is the #1 source of news and information for the buyers, gatekeepers, and tastemakers.
Comichron
Comichron is the world's largest public repository of comic-book sales figures, featuring data from the 1930s to today about comic book and graphic novel circulation, cover prices, and market shares on its website, www.comichron.com. With data and analysis on the distant past as well as the present, Comichron serves as a trusted resource for academics studying the historical reach of the medium and for collectors seeking accurate information about how many copies of a comic book originally circulated.
According to New Estimate by ICv2 and Comichron
Posted by ICv2 on June 29, 2021 @ 10:00 am CT
 View Gallery: 3 Images
 MORE COMICS

Coming in November
August 7, 2025
Fantagraphics will release Tales of Paranoia, a new one-person anthology comic by Robert Crumb, in November.

From Marvel Comics
August 7, 2025
Artists Marco Forcelloni and Nicky Nicotera reimagine classic Marvel Comics covers with the characters of Disney and Pixar's Toy Story in new homage variant covers on sale this November.
MORE MARKETS
Sales Rankings Based on Comic Store POS Data
August 6, 2025
These are unit and dollar sales rankings based on sales tracked at point-of-sale by the ComicHub system at stores selling American graphic novels (and manga) around the world.
Sales Rankings Based on Comic Store POS Data
August 5, 2025
These are unit and dollar sales rankings based on sales tracked at point-of-sale by the ComicHub system at stores selling American comics around the world.
