


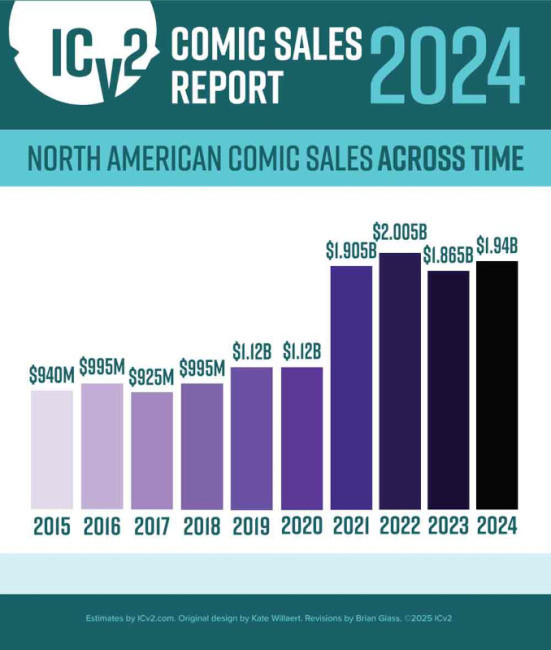
Total comics and graphic novel sales to consumers in the U.S. and Canada were around $1.94 billion in 2024, up 4.0% from the $1.87 billion in sales in 2023. Last year had seen a re-set after rapid growth during Covid, with sales down 7% from 2022 (see "Comics and Graphic Novel Down 7%"). Both years were up a lot from the pre-Covid era; sales in 2024 were up 73% from 2019.
ICv2's Take
"The reversal from last year’s decline is a reassuring sign that the medium can still grow from its current levels, building on the customers that flowed into the business during the pandemic," ICv2 President Milton Griepp said in a statement accompanying the release of the numbers. "For comic stores, despite all the changes in the past two decades, as go Marvel and DC, the Big Two publishers, so goes the business, and we saw better comics from both in 2024 following a multi-year slump in creativity."
Sales by Format and Channel
The comic book format had a good year in 2024, with dollar sales up 12.2% over 2023, we estimate. At $460 million in sales, the periodical format hit a 15-year high in 2024. That’s not necessarily a sign that there are more customers; multiple retailers told us that their unit numbers were down despite dollar sales increases. And in our interviews with comic retailers, we ran into significant variation in results by store; some stores had sales declines, others had increases well beyond the market average.
Graphic novels were down 1.4% in the book channel because manga, which is still coming off Covid highs, was not completely offset by growth in other sub-categories. Graphic novel sales were up 13.3% in the comic store channel.
For more in-depth analysis of the year-over-year trends, see "In-Depth -- Comics and Graphic Novel Sales Up in 2024."
Methodology
There have been some changes in methodology for 2024, which we itemize here.
For comic stores, the analysis now uses data based on sales tracked at point-of-sale by the ComicHub system at over 125 stores. During the early stages of our use of that information, we used that data to build a model of sales for the entire comic store channel using comparisons developed during periods in which ComicHub and Diamond reporting overlapped. Since Diamond stopped reporting sell-in indexes which could be used to develop sales estimates for individual titles, we’ve used percentage changes in ComicHub sales, adjusted for changes in the number of stores reporting, to estimate trends for the overall market.
This methodology has risks; if, for example, sales in the ComicHub stores are not changing at the same rate as sales in the overall market, our estimates will be off. As this is a small, non-random sample of over 3,000 stores selling American comics worldwide, these rankings may not be typical for all stores, but they do represent a variety of locations and store emphases. And it’s the largest aggregation of comic store data available at this time, so it’s all we’ve got to go on. We believe trends in the ComicHub stores are generally reflective of overall trends.
For the book channel, we obtain data from Circana BookScan, which allows us to see the total graphic novel sales in stores tracked by the service. Unlike recent years, Circana no longer provides ICv2 with a full list of title-by-title sales information for the year as part of an overall change in what info they release to non-subscribers. Circana did provide us with unit and dollar totals by graphic novel category for the year, which we used to build our market size estimates. Circana collects weekly point-of-sale data on print books from over 16,000 locations including e-tailers, chains, mass merchandisers, independent bookstores, and more. Circana covers approximately 85% of the U.S. trade print book market. We include an estimate for the non-Circana bookstore market and for sales in Canada in our market estimates.
Some publishers classify titles that are primarily text, or art books, as graphic novels; in past years, we've removed those titles by hand from the dollar totals. For 2024, we used an estimate of the non-graphic novels based on previous year BookScan data to adjust the total. BookScan began incorporating ComicHub data into its reports in 2020, so we accounted for the ComicHub portion when estimating the size of the book channel.
As presented above and in the accompanying infographics, the analysis was divided up between periodical comics (what some call "floppies" or "pamphlets") and graphic novels. All print figures are calculated based on the full retail price of books sold into the market, and do not account for discounting or markup.
Via Growth in Comic Stores
Posted by Milton Griepp on July 11, 2025 @ 5:43 am CT
 View Gallery: 3 Images
 MORE COMICS

Showbiz Round-Up
August 25, 2025
Hollywood news continues to trickle in late into August. Time for a round-up!

At Anime NYC
August 22, 2025
The winners of the 2025 American Manga Awards, organized by Anime NYC owner LeftField Media and Japan Society, were announced in a ceremony at Anime NYC in New York on August 21.
MORE MARKETS

In Year-Over-Year ICv2 Analysis
August 19, 2025
Dollar sales of horror comics were up by 25% this summer, according to a year-over-year ICv2 analysis.

Top-Selling Horror Comics of the Summer
August 19, 2025
We noticed two trends in this summer's top-selling horror comics.
